

Managing suspicious customers is essential to reduce potential losses, but how do you flag them?
This issue explores technical strategies for identifying, monitoring suspicious behaviour, aka SUStomer Management — providing actionable insights for a loss-free business.

Top SUStomer Management Methods for Ecommerce Brands
1. Pre-Purchase: The First Line of Defense
a) Cross-Brand Behavioral Analytics: The Power of Shared Data
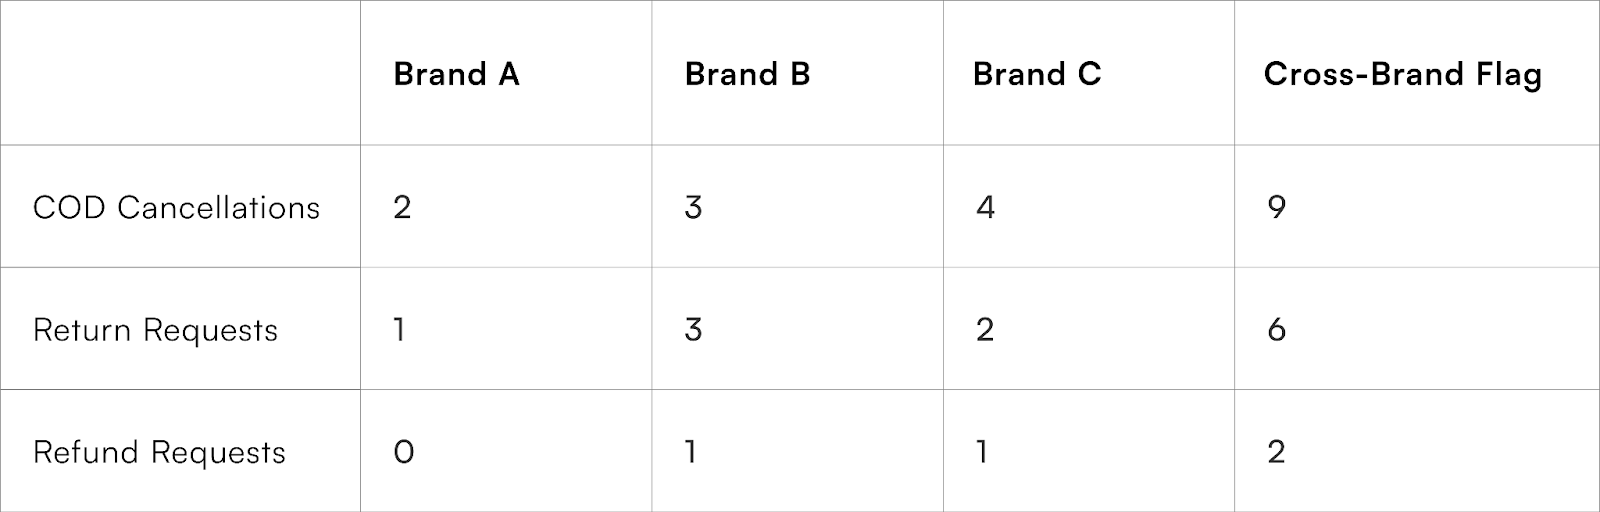
Sharing behavioural data across multiple D2C brands is akin to creating a security network. If one brand experiences suspicious activity from a customer, it can alert others to the potential fraud risk. By combining data points such as order cancellations, refund requests, and average order values (AOVs) across brands, a more complete picture of customer behaviour can emerge.
For instance, say Customer X has cancelled five COD orders with Brand A, returned three products to Brand B, and filed refund requests with Brand C. Individually, these incidents may not raise alarms, but cross-brand analytics reveal a clear pattern of suspicious behaviour.
Industry Case Study: 35% of D2C brands have reported a 22% reduction in COD fraud by participating in shared behavioural analytics programs.
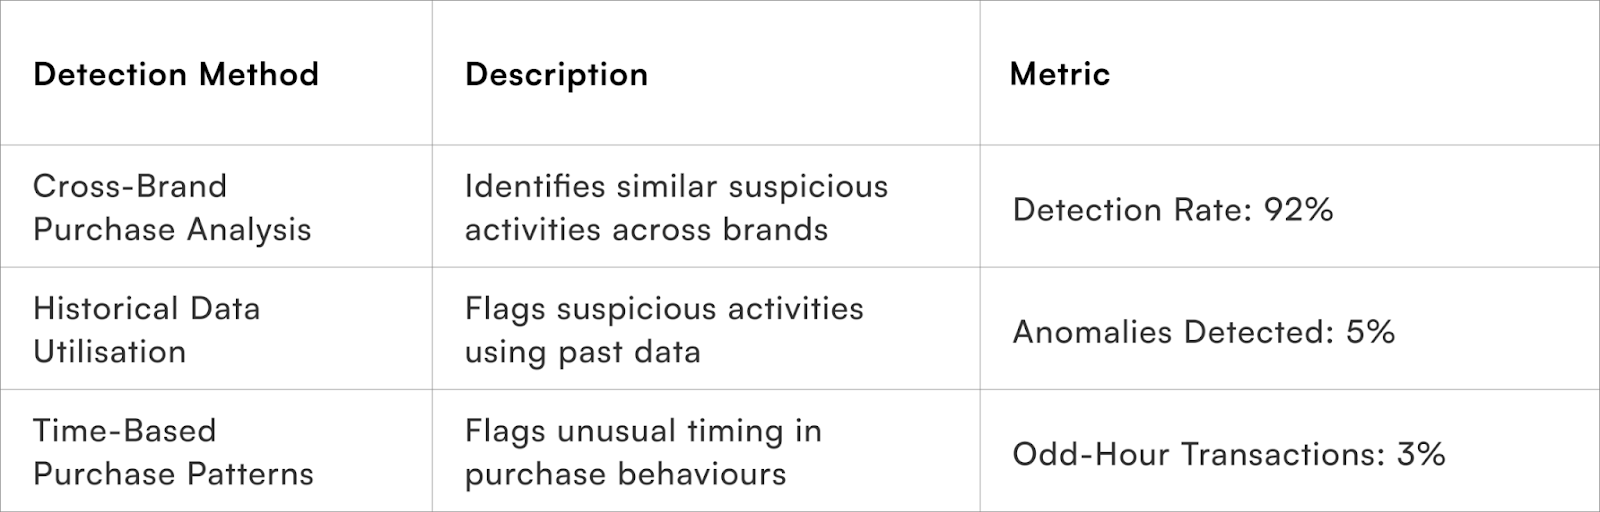
Utilising data across multiple brands (500+ Indian D2Cs), advanced behavioural analytics can identify complex patterns indicative of fraud:
- Cross-Brand Purchase Analysis: Detects customers making similar high-risk purchases across multiple brands.
- Anomalous Shopping Behaviour: Identify deviations from typical shopping patterns using data from a broad customer base.
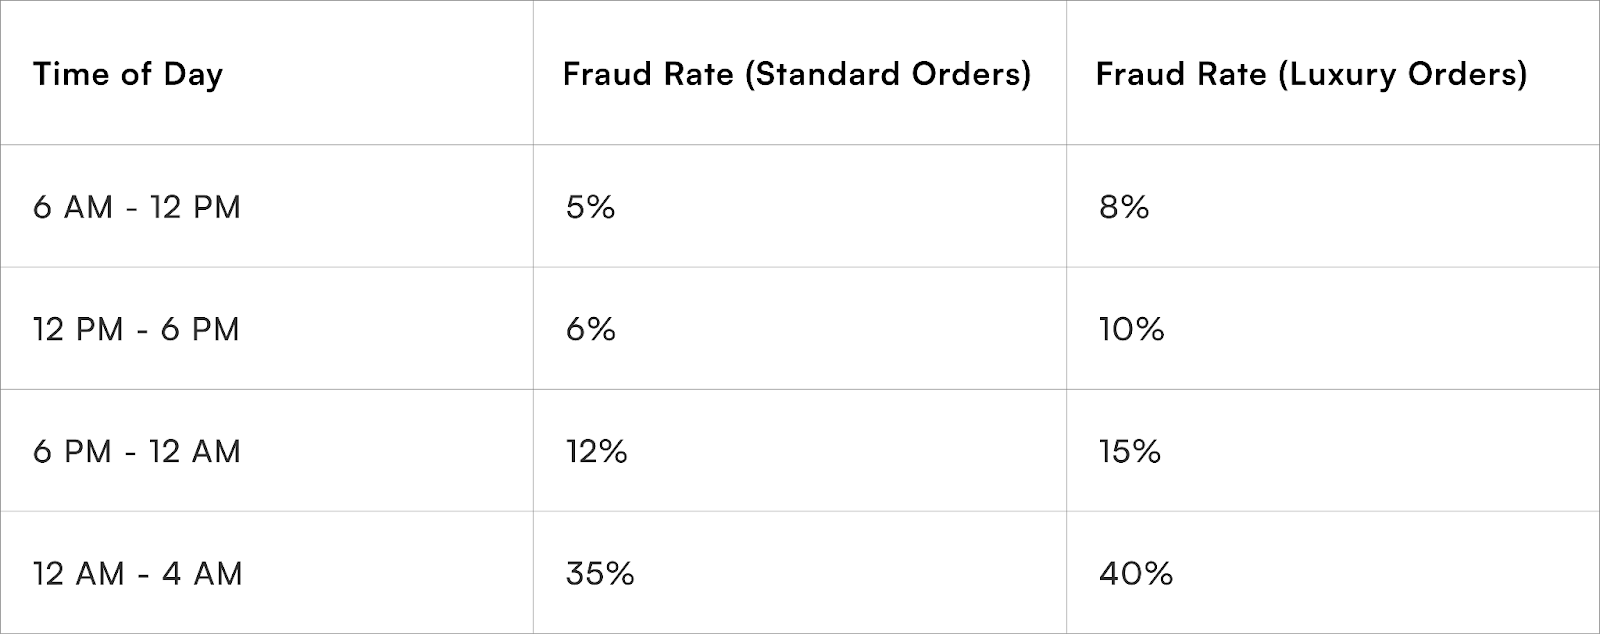
- Time-Based Purchase Patterns: Analyse the timing of purchases to detect unusual patterns, such as purchases made during odd hours consistently.
When these behaviours are combined, the "SUStomer" score increases, triggering an alert across all participating brands.
b) Behavioral Detection at Checkout: Flagging the Red Flags
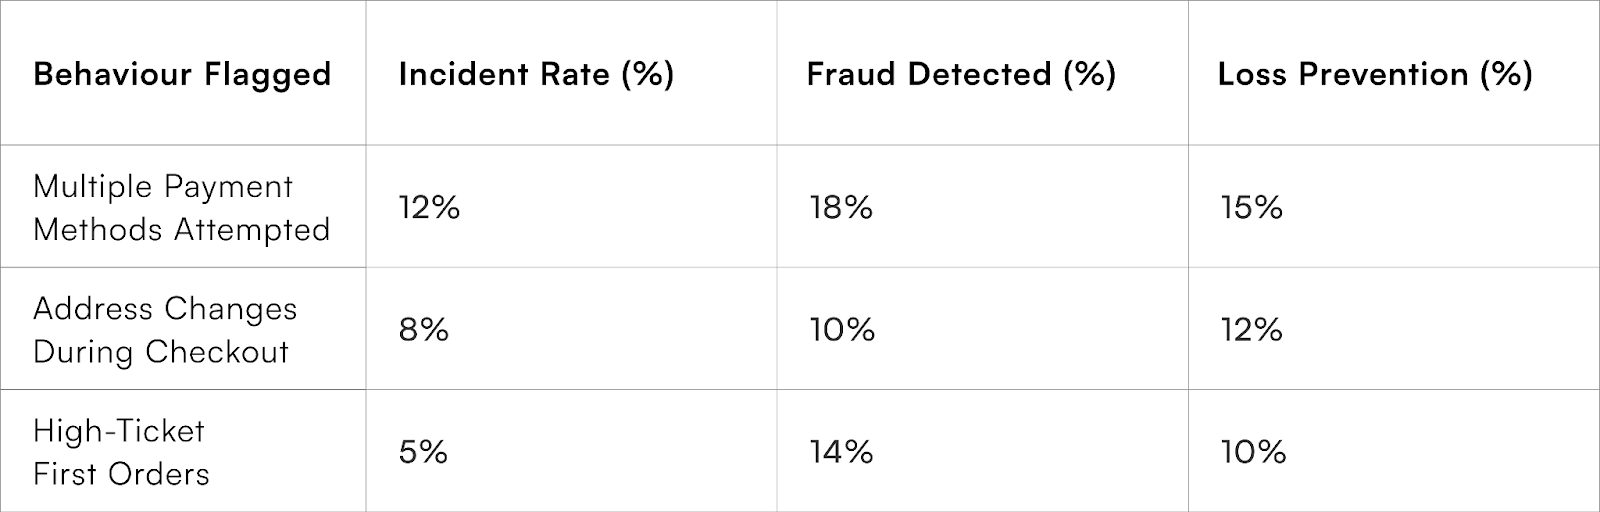
Using behavioural analytics during the checkout process can help detect potential fraud before an order is placed. Implementing tools like ML-driven behavioural monitoring allows brands to flag suspicious actions such as:
- Multiple payment method attempts: A customer trying several payment methods, particularly when coupled with changes in delivery addresses.
- High-ticket first orders: A customer with no purchase history placing an order well above the average AOV.
23% of all checkout fraud is detected through AI-driven behavioural monitoring, leading to a 14% reduction in post-purchase fraud.
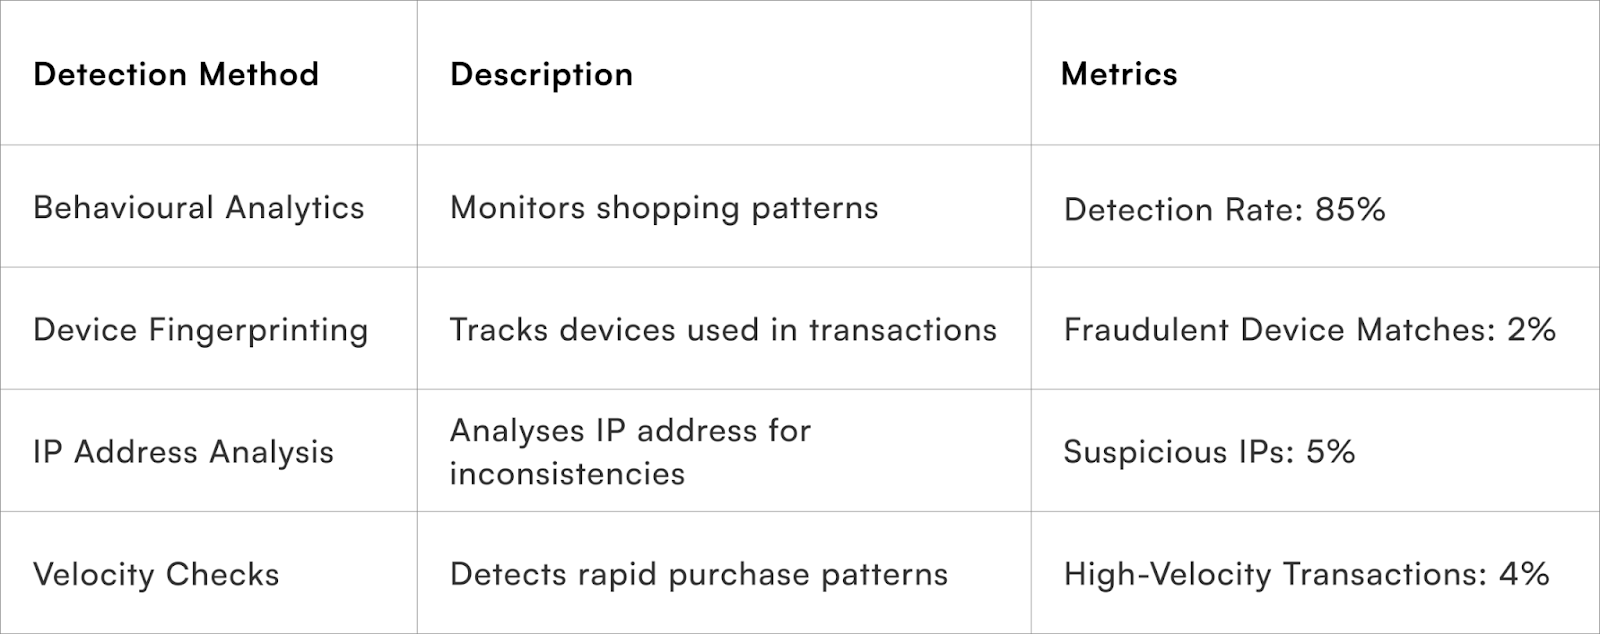
Detecting suspicious customers at the checkout stage is essential to prevent fraudulent transactions. Effective techniques include:
- Behavioural Analytics: Monitor unusual shopping patterns, such as high-value purchases from new accounts.
- Device Fingerprinting: Identify and track devices used in transactions to spot suspicious activities.
- IP Address Analysis: Detects inconsistencies such as mismatched billing and shipping addresses or locations known for fraud.
- Velocity Checks: Identifying rapid succession of purchases that deviate from normal customer behaviour.
Expanding on checkout monitoring, D2C brands can implement more technical behavioural tracking systems. This might include analysing micro-patterns such as:
- Keystroke dynamics,
- Mouse tracking (how long the cursor hovers over the “Place Order” button), and
- Session duration (e.g., customers who spend more than an average amount of time on payment pages).
A case in point is Company X, which introduced biometric checkout monitoring by analysing typing speed and mouse movement. This simple technique led to a 20% drop in fraudulent orders.
Advanced Data Analytics Models for Cross-Brand Detection
Incorporating AI-driven data analysis models, such as random forest classifiers and gradient boosting algorithms, allows brands to process millions of data points in seconds. These algorithms sift through customer behavioral data across multiple brands to identify anomalies. In one instance, a random forest model applied to a dataset of over 1 million customers across five D2C platforms flagged 15,000 high-risk customers within the first week of implementation.
Fraud Incidents by Time of Day (Indian Multi-Brand Retailer)
This analysis extends to:
- Holiday periods
- Product launches
- Offer periods and even
- Custom, brand specific analysis periods
2. Post-Purchase: When Things Start to Get Tricky
a) First-Time Customer AOV Analysis: Know the Threshold
In the post-purchase stage, the Average Order Value (AOV) for first-time customers can reveal suspicious activity. Fraudulent customers often try to game the system by placing abnormally large orders and selecting COD as the payment method, knowing that they can cancel or refuse the order at delivery.
Example: Brand D noticed that customers with no previous purchase history who placed orders 50% higher than the typical AOV were 40% more likely to cancel their orders upon delivery.
Analysing the Average Order Value (AOV) for first-time customers across brands to detect potential trial-based fraud:
- High AOV for First-Time Purchases: Flag customers who make purchases with significantly high AOV for their first transaction, and disable COD option
- Product Diversity Analysis: Identify customers who purchase a diverse range of high-value products for their first order as it could be a Trial-Focused purchase. Meaning, there is a high probability of return.
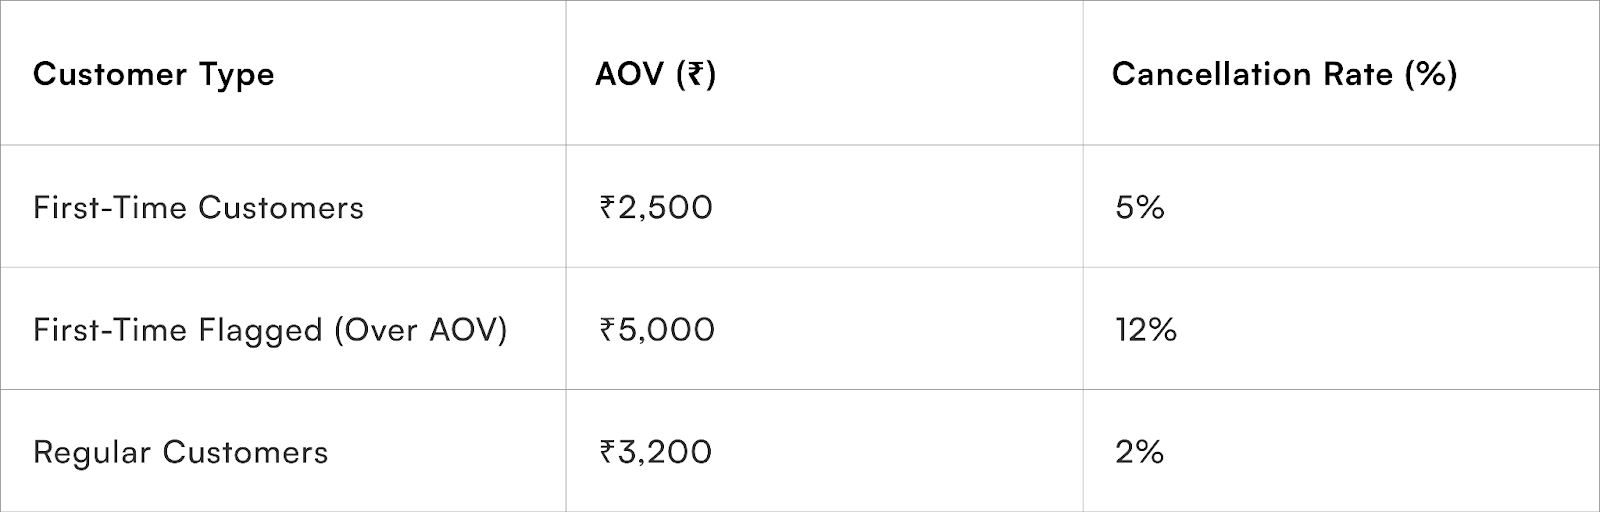
Flagging and requiring additional verification for first-time orders over a certain value can significantly reduce loss from fraudulent behaviour.
b) Post-Purchase Monitoring: Combining Historical and Real-Time Data
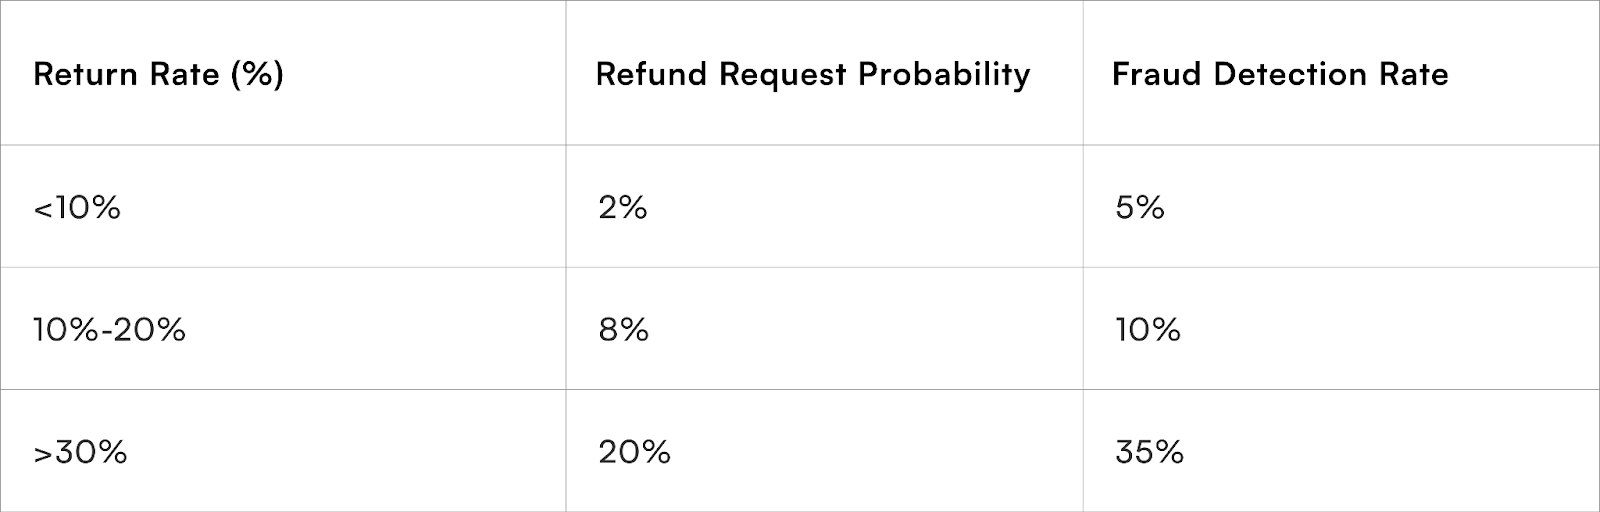
One of the most effective post-purchase strategies is leveraging historical and real-time data to detect potential fraud. Monitoring behaviours like return rates, refund requests, and complaints lodged across multiple platforms can help identify patterns. Additionally, cross-brand monitoring can identify customers who exploit return and refund policies across the board.
A leading D2C brand in India identified that customers with a return rate of over 30% were twice as likely to request refunds on future orders. Implementing a flagging system for these customers helped reduce fraud-related losses by 18%.
By monitoring these behaviours, brands can detect SUStomers early, thus avoiding further losses.
Monitoring customer activities post-purchase can help detect and mitigate fraud that occurs after the transaction. Effective strategies include:
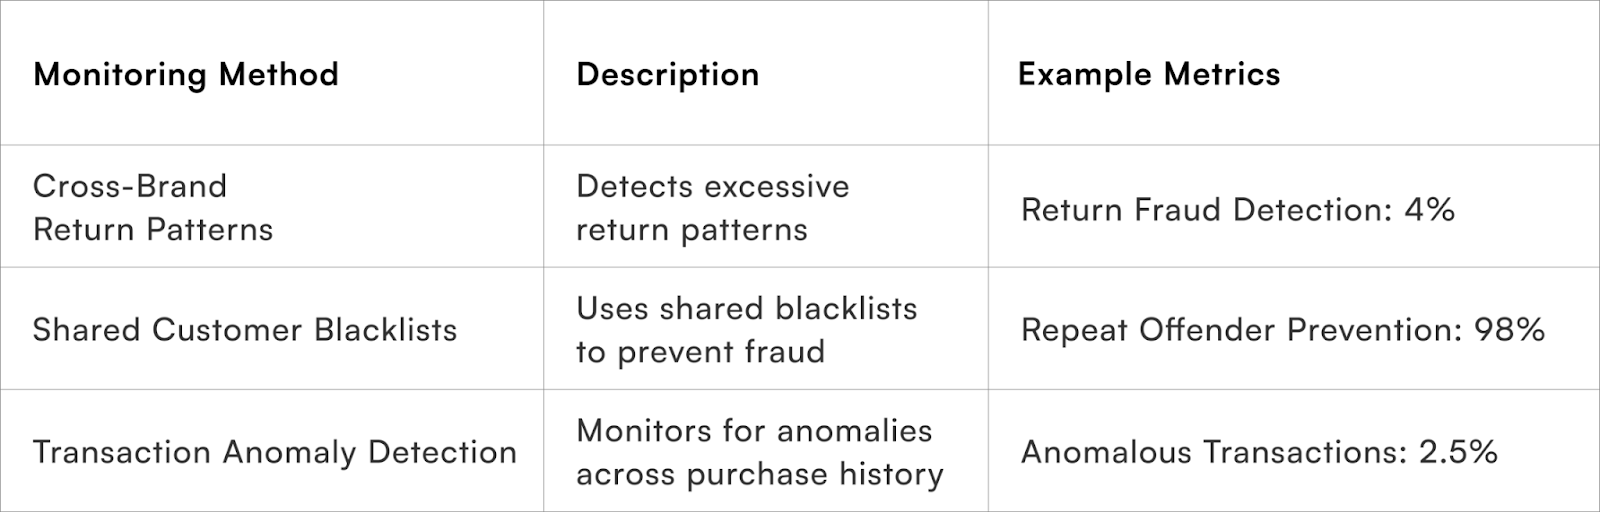
- Cross-Brand Return Patterns: Identify patterns of excessive returns across multiple brands that may indicate fraudulent behaviour.
- Shared Customer Blacklists: Utilise shared blacklists of known fraudulent customers across brands to prevent repeat offenders.
- Order Tracking and Alerts: Monitor high-value orders and send alerts for suspicious activities.
- Customer Feedback Analysis: Analyses reviews and feedback for signs of fraudulent behaviour.
- Account Activity Monitoring: Regularly check for unusual activities in customer accounts, such as multiple failed login attempts or sudden changes in order patterns.
b) Post-Purchase Monitoring: COD Order Cancellation Monitoring
COD fraud often follows a predictable path, and machine learning algorithms can be used to flag suspicious patterns. For instance, the average cancellation rate for COD orders in India stands at 30%, but this number varies greatly based on region, product type, and customer history.
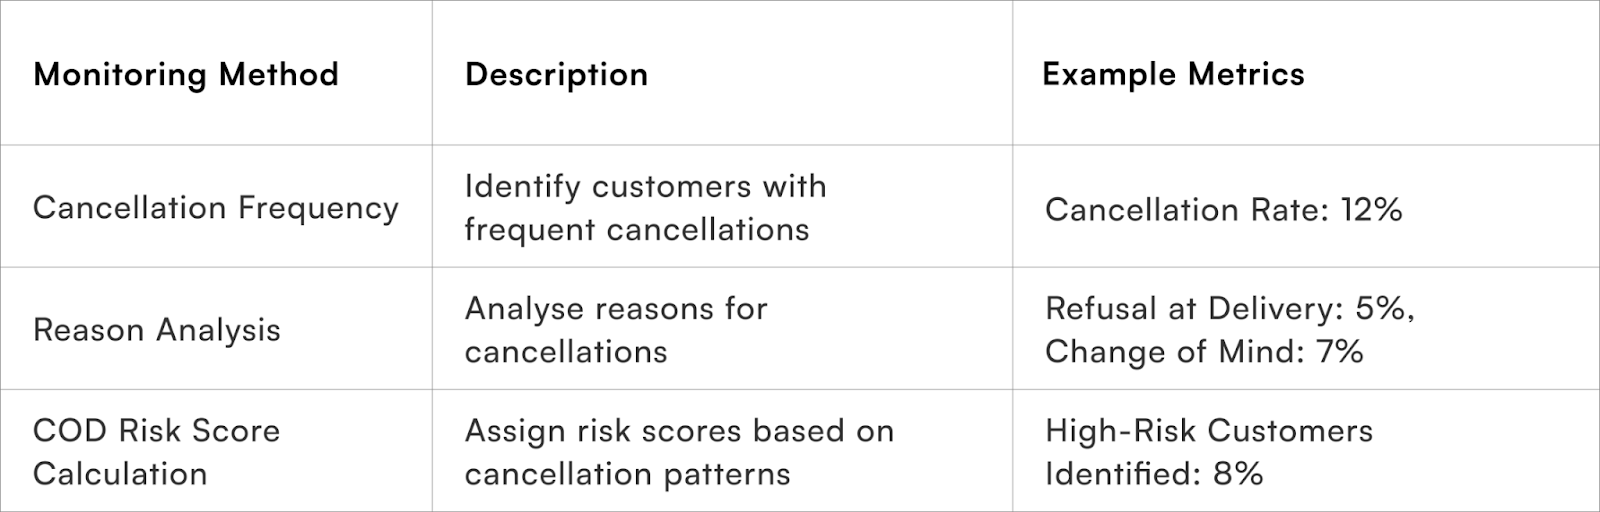
Monitoring COD order cancellations across brands to detect suspicious activities:
- Cancellation Frequency: Flag customers with a pattern of frequent cancellation of COD orders.
- Reason Analysis: Analyse reasons for COD order cancellations, such as refusal at delivery or change of mind.
- COD Risk Score Calculation: Assign risk scores based on the frequency and reasons for COD order cancellations.
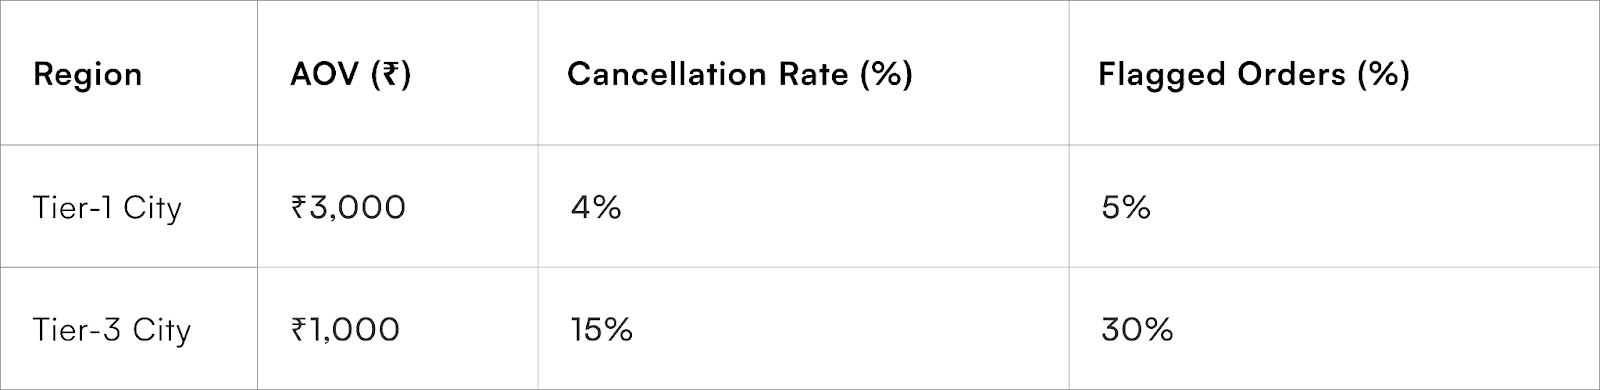
A regional breakdown reveals that:
- Tier-1 cities have an average COD cancellation rate of 15%.
- Tier-2 cities show 25% cancellations, and
- Tier-3 cities spike up to 45% in high-risk areas.
Brands that utilise machine learning-based monitoring can track patterns like how frequently a customer cancels COD orders over a specified timeframe. For example, a fraud detection system could trigger an alert when a customer cancels more than 3 orders in 30 days.
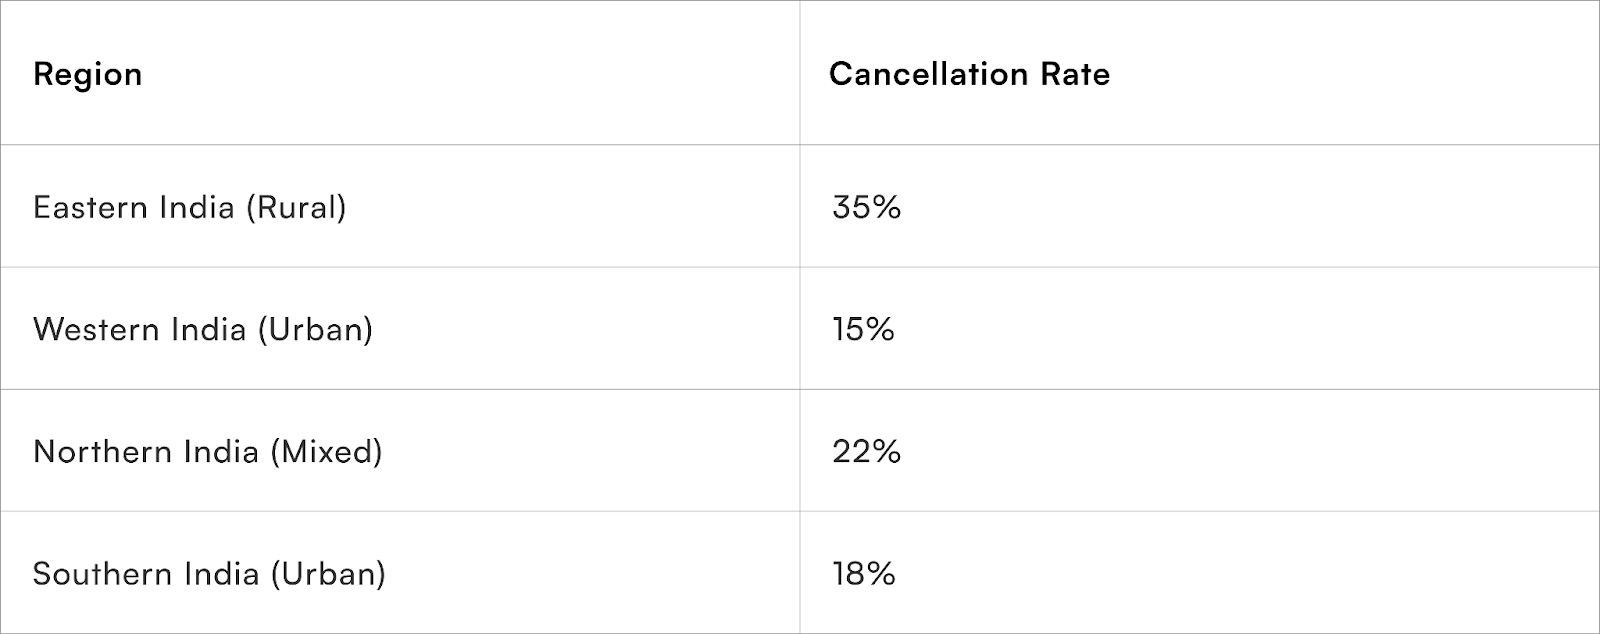
While COD cancellations are a significant challenge, identifying regional fraud patterns is crucial. In India, where COD is more prevalent, order cluster analysis reveals regional hotbeds of fraud. For instance, the eastern region of India sees cancellation rates peaking at 35%, particularly in rural areas, while the southern region reports 18%.
Using machine learning, brands can build predictive models based on:
- Order frequency by region,
- Time of placement, and
- Historical COD acceptance rates.
With predictive analytics, an Indian fashion retailer reduced COD-related losses by 25% over six months by introducing dynamic COD limits based on regional risk.
COD Cancellation Rates by Region (Indian D2C Study)
3. Post-Delivery: The Final Frontier for Fraud Detection
a) Limiting COD Losses with Adaptive Systems
COD orders are often the primary targets for SUStomers, particularly in the Indian market where COD remains popular. However, brands can limit COD-related losses by using adaptive payment measures. For instance, after a customer cancels multiple COD orders, disabling COD for that customer or requiring prepaid orders is a proven way to minimise loss.
29% of all cancelled COD orders are flagged as fraudulent, and brands that implemented adaptive COD measures saw a 22% reduction in COD-related losses.
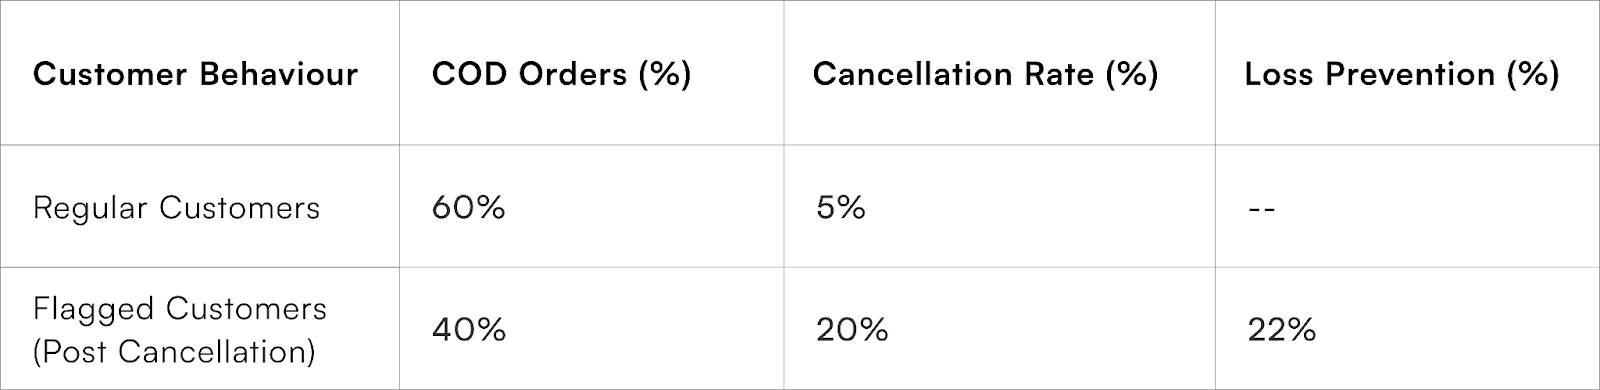
Using dynamic payment options based on customer history significantly reduces risk and increases profit retention.
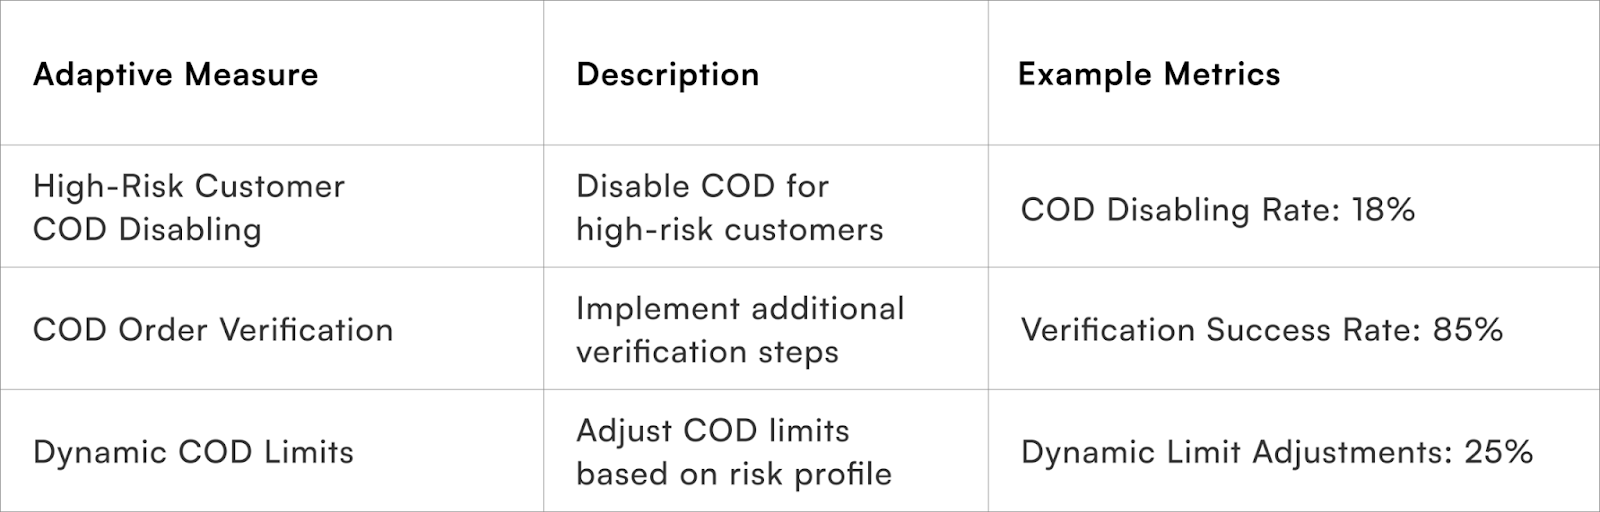
Implementing adaptive strategies to limit COD losses while ensuring customer satisfaction:
- High-Risk Customer COD Disabling: Automatically disable COD for customers flagged as high-risk based on cross-brand data insights.
- COD Order Verification: Implement additional verification steps, such as OTP confirmation, for COD orders from high-risk customers.
- Dynamic COD Limits: Adjust COD limits dynamically based on the risk profile of the customer and transaction.
b) Custom Alerts and Machine Learning: The Future of Fraud Prevention
As technology advances, the use of machine learning to generate custom fraud alerts is becoming more common. Algorithms can analyse vast datasets, identifying correlations that manual monitoring might miss. For example, machine learning models can detect patterns in return behaviours, refund requests, and order values to predict fraudulent activity before it happens.
Using machine learning to analyse over 10,000 data points, brands created a custom alert system that flagged suspicious orders with 89% accuracy. As a result, their post-purchase fraud rate dropped by 25% within the first year of implementation.
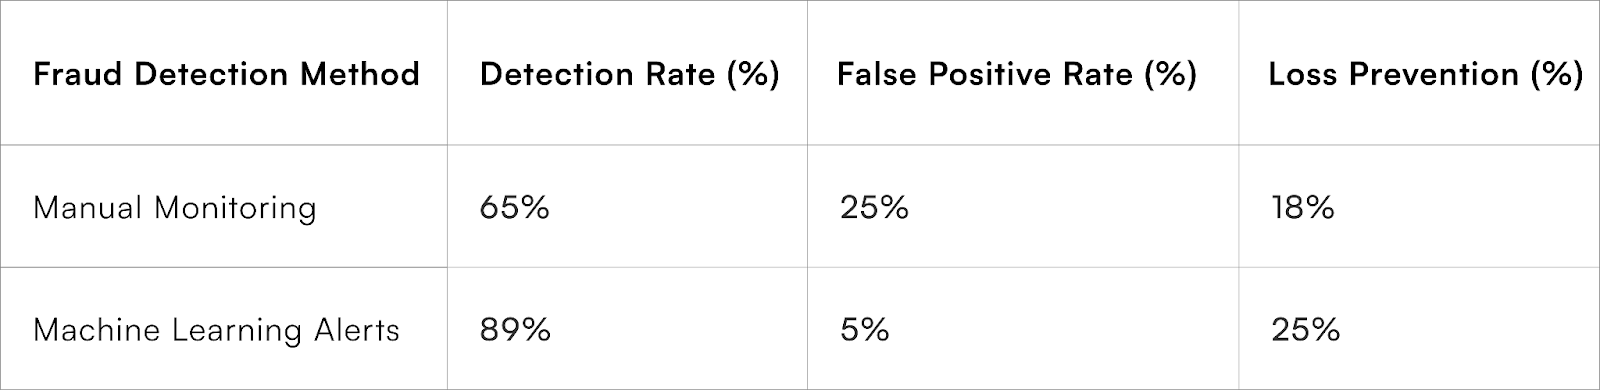
Machine learning models are the future of SUStomer management, providing insights far beyond human capabilities.
Leverage extensive data to generate insights and custom alerts for potential fraudulent activities:
- Custom Alert Generation: Create tailored alerts based on specific fraud patterns detected across multiple brands.
- Data Visualisation Dashboards: Provide real-time visualisation of potential fraud activities and trends.
- Proactive Fraud Detection: Use predictive analytics to proactively identify potential fraud before it occurs.
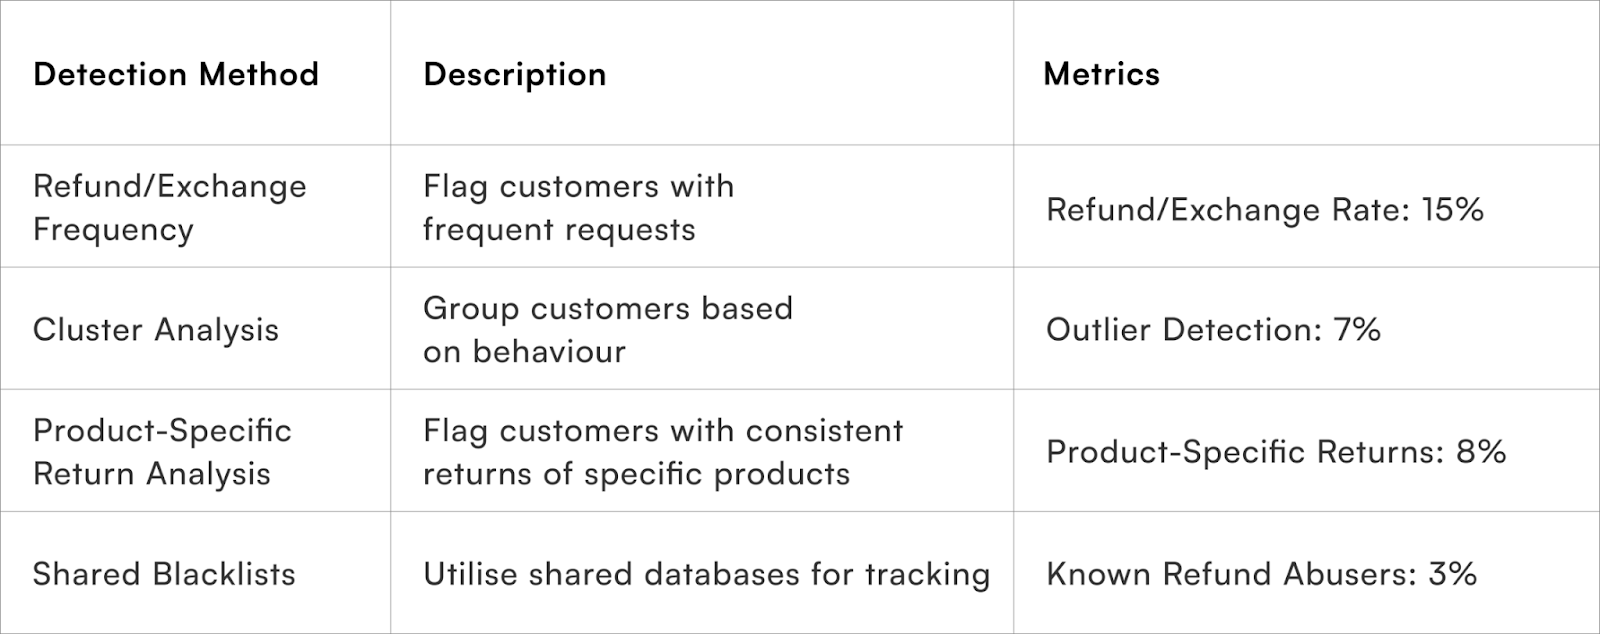
c) Cross-Brand Refund/Exchange Request Analysis
Utilising data from multiple brands to identify patterns of excessive refund or exchange requests:
- Refund/Exchange Frequency: Flag customers with a history of frequent refund or exchange requests across different brands.
- Product-Specific Return Analysis: Flag customers who consistently return specific types of products across multiple brands.
- Cluster Analysis: Group customers based on similar refund/exchange behaviour and identify outliers.
- Shared Refund/Exchange Blacklists: Utilise shared databases to track customers known for repeat refund abuse across brands.
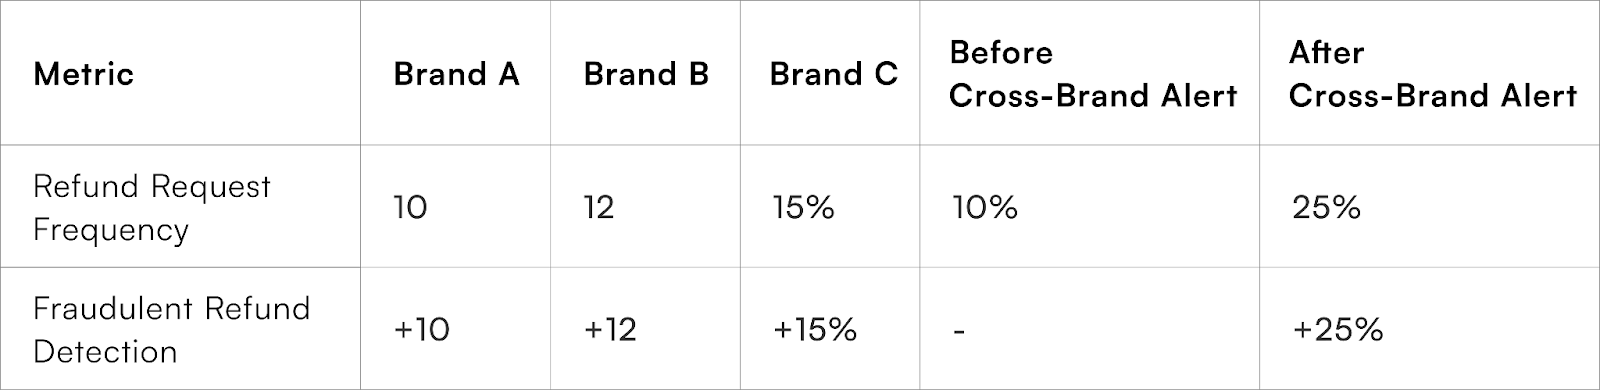
Refund and exchange abuse is a growing concern, particularly in high-AOV products such as electronics and luxury items. Cross-brand refund request syncing is one solution. Here, brands pool data related to refund and exchange requests.
Let’s assume Customer A has made an unusually high number of refund requests across three brands.
Individually, each brand might see the requests as isolated incidents. However, when analysed together, a pattern of abuse emerges.
A D2C electronics brand that integrated cross-brand refund analysis found that 20% of their high-value refunds originated from repeat offenders—customers flagged for multiple refund attempts on other platforms. After implementing cross-brand data sharing, they reduced refund fraud by 15% in six months.
Cross-Brand Refund Detection Rates
4. Emerging Tactics for SUStomer Management: Going Beyond the Basics
a) Peer Group Analysis: Predictive Insights from Similar Profiles
Peer group analysis allows brands to compare a customer’s behaviour with those of similar demographic profiles. By segmenting customers into groups based on factors like geography, order history, and purchasing power, brands can identify outliers whose behaviour doesn’t match the expected profile. For instance, a customer from a low-income region placing high-ticket orders might be a red flag for fraud.
Example: A food delivery service noticed that customers in rural regions, with lower AOVs, flagged an unusually high cancellation rate for larger orders. Upon investigation, these orders were linked to a ring of fraudulent activities targeting rural COD deliveries.
Analyse customer behaviour in the context of peer groups to identify outliers and potential fraud:
- Cluster Analysis: Group customers with similar behaviours and identify outliers.
- Peer Group Comparison: Compare individual customer behaviour against peer group norms.
- Suspicious Activity Scoring: Assign scores to customers based on deviations from peer group behaviour.
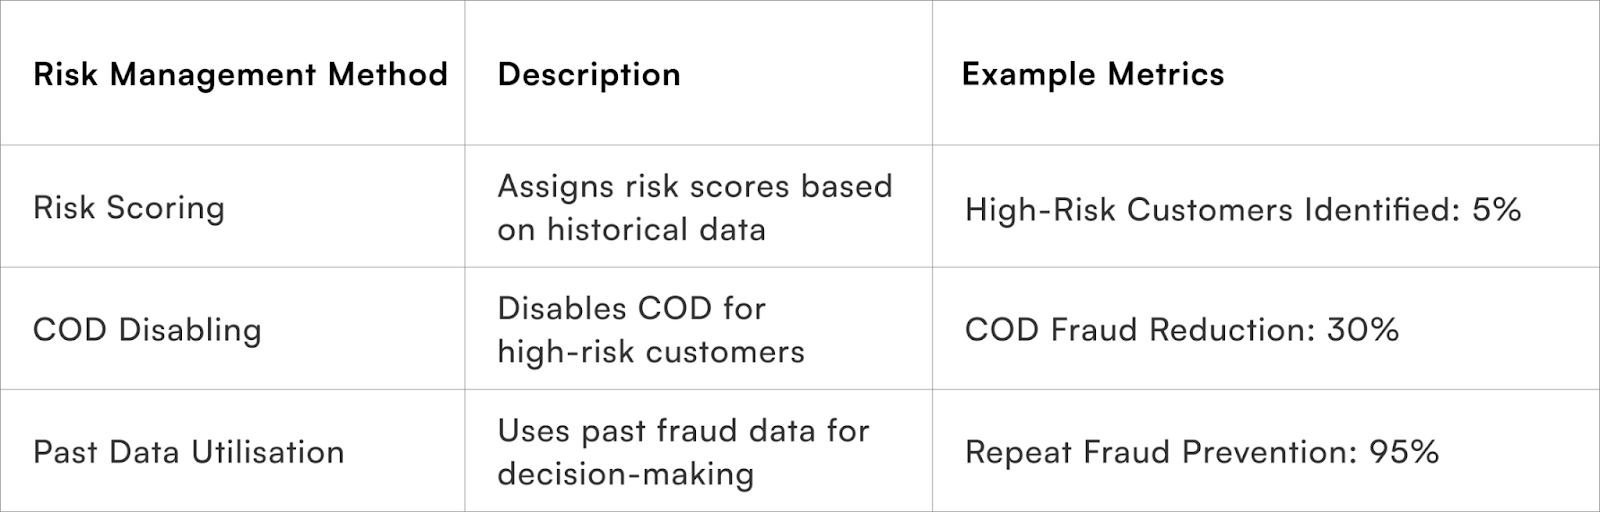
b) Advanced SUStomer Scoring: Assigning Risk Scores to Customers
One of the most powerful techniques in SUStomer management is assigning risk scores to customers based on their behaviour. This approach combines multiple factors—order value, return rate, geographical location, payment method, and more—into a single score. Customers with higher scores are flagged for additional verification, adaptive payment options, or monitoring.
Risk scoring systems have proven incredibly effective, with some D2C brands reporting fraud detection rates as high as 90%. These systems can continuously learn from new data, adjusting scores dynamically to reflect changing customer behaviour.
Using cross-brand data, we can implement strategies like disabling Cash on Delivery (COD) for high-risk customers:
- Risk Scoring: Assigns a risk score based on historical data from multiple brands.
- COD Disabling: Automatically disables COD for customers with high-risk scores, even when they purchase from a new brand.
- Past Data Utilisation: Leverages past fraud data to make informed decisions about current transactions.
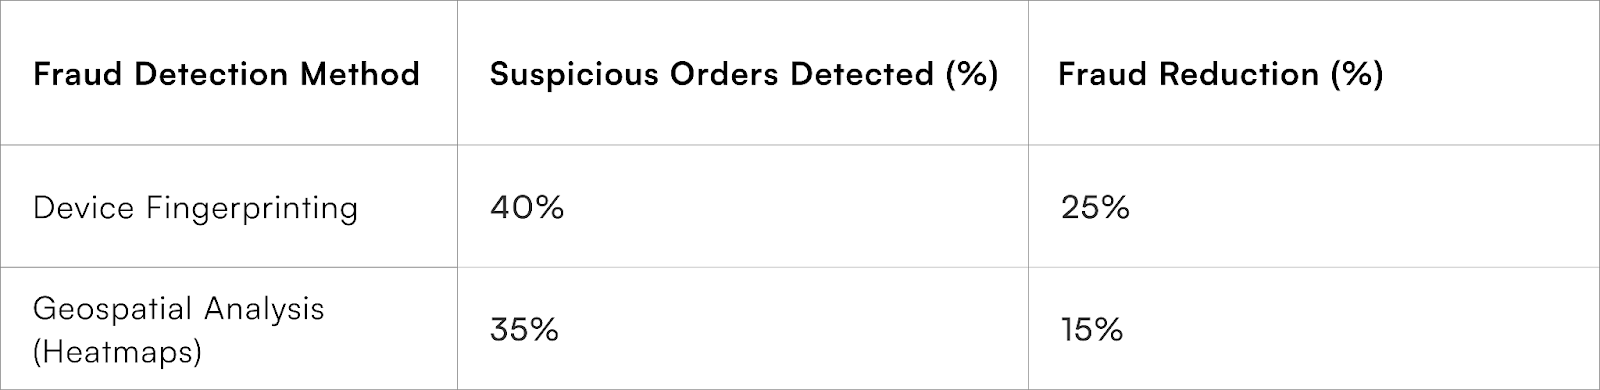
Geospatial Analysis for Fraud Detection
Brands can also leverage geospatial analysis to detect fraud-prone regions. For example, a food delivery brand used geospatial mapping to block deliveries to high-risk areas, reducing fraudulent orders by 15%.
Conclusion: Winning the Battle Against SUStomers
For Indian D2C brands, the threat posed by fraudulent customers is real, but it is not insurmountable. By deploying advanced SUStomer management techniques like behavioural monitoring, machine learning, and risk scoring, businesses can protect their bottom lines and continue delivering great service to legitimate customers.
As fraud tactics evolve, so must the tools and strategies used to combat them. The future of SUStomer management is in continuous innovation and data-driven decision-making—an investment that is guaranteed to pay off.


FAQs (Frequently Asked Questions On SUStomer Management for D2C India)
1. What is SUStomer Management and why is it important for Indian D2C brands?
SUStomer Management is the process of identifying, monitoring, and mitigating suspicious or fraudulent customer behaviour to reduce losses. It is crucial in India’s high-COD, return-prone market to protect revenues and maintain operational efficiency.
2. How does cross-brand behavioural analytics help detect suspicious customers?
By sharing behavioural data like order cancellations and refund requests across multiple D2C brands, suspicious patterns emerge that individual brands might miss. This collective intelligence reduces COD fraud by up to 22% and flags customers who habitually abuse policies.
3. What techniques are used to flag suspicious customers at checkout?
Machine learning monitors multiple payment attempts, high-value first orders, keystroke dynamics, device fingerprinting, and IP address anomalies. These help detect fraud early, reducing post-purchase fraud by 14% and declining fraudulent orders by 20% in case studies.
4. How can D2C brands limit COD-related losses with adaptive payment measures?
Brands can disable COD for high-risk customers, implement OTP verification for payable orders, and dynamically adjust COD limits based on customer history and regional risk factors, leading to a 22% reduction in COD-related losses.
5. Why is post-purchase and cross-brand monitoring critical for fraud prevention?
Monitoring return rates, refund frequency, and customer feedback across brands reveals repeat offenders who exploit return policies. An Indian D2C electronics brand reduced refund fraud by 15% through cross-brand monitoring.
Talk to our experts for a customised solution that can maximise your sales funnel
Book a demo
.webp)
.png)